Page 2: Disease Spread Project
Unit 5, Lab 2, Page 2
On this page, you will model the spread of a disease in a population.
Note: There was a disease spread simulation in BJC long before covid-19, but we want to acknowledge that right now the spread of a disease isn’t an abstract question. Everyone has been affected by isolation at home, and some students may have lost loved ones to this disease. Medical researchers do use simulations (much more complex than this one) to try to predict the future course of the disease.
Suppose you are a medical researcher and would like to understand the factors that contribute to the spread of disease. In particular, you want to know the effect of population size on the time it takes for everyone to be infected, under the simplifying assumption that once infected, a person stays infected.
-
 What would be a sensible hypothesis on how population size affects the elapsed time?
- What if the people interacted with one and other more frequently?
You may not have enough data to test your hypothesis, and it would be unethical to induce the disease in a population just to gather new data. A simulation would allow you to test your hypotheses without the constraints of time, cost, and ethics.
-
- a population variable that stores the total number of people (represented by clones of a sprite)
- a percent initially infected variable that stores the fraction of the population who are sick at the beginning of the simulation
- a speed variable that stores the pace at which the clones move
- a sprites ready? variable that stores a Boolean that keeps track of whether or not all the clones have been created and the simulation can begin
- a number infected variable that keep track of how many clones are currently infected
- an infected? sprite-local variable that stores a Boolean that keeps track of whether or not a clone is sick (each clone will have its own separate variable with that name)
-
two costumes, sick (
 ) and well (
 ), that display the status of each clone
-
You learned how to clone a sprite in Unit 3 Lab 1 Page 5: Building a Tic-Tac-Toe Board.
The primitive block
 reports a list of sprites that are near the sprite that uses it.
a
simulate diseasefunction for you to complete that takes three inputs: total population, percent initially infected, and sprite speed; creates the clones that enact the simulation; and outputs the time until the entire population is infected -
an
initialize simulationblock that initializes the global variables and sets the parent sprite costume -
a
touching infected person?predicate for you to complete that checks whether the current clone is being exposed to the disease -
an
initialize cloneblock that decides whether a clone will start out sick and positions it randomly on the stage -
a
when I start as a clonescript for you to complete that moves the clones until they are all infected
-
Complete the
simulate diseasefunction, thetouching infected person?predicate, and thewhen I start as clonescript.
You want to know the effect of population size on the time elapsed. Because there is some randomness in the simulation, you are going to get some variation in the reported time. (This isn’t a bug; in real life, random events affect the elapsed time.)
-
AAP-3.F.8
Write a function that takes population size as input, runs the simulation ten times, keeps the percent initially infected at 10 and the speed of infection at 2, and reports the average time elapsed.

- Call this function four times with different populations (50, 100, 150, and 200), and write down the results
-
AAP-3.F.7
Using clones is a form of parallelism. But as you learned on the Unit 5 Lab 1 Page 8: Parallelism, because the clones are all running on one processor, cloning doesn’t give you any speedup.
This is a simplified model. There are many things you could do to make the model more realistic. For example, you could make the infected people get better over time or some people could be immune to the disease, but you will always have to make some simplifications.
- Now conduct a similar experiment holding population size constant and varying the percent initially infected. Come up with a hypothesis for this relationship.
- Then conduct an other experiment by varying movement speed and keeping population size and percent initially infected constant, and create a third hypothesis.
- Add some more inputs to the simulation block. We’ve suggested people getting better after time or getting healed by doctors, but there are many more you could think of.
- You have hypotheses for changing only one variable, but what if you change two things? Do they affect the result independently, or is there a cross effect (for example, if sick people heal quickly, does that change the relationship between population size and time elapsed)? Run experiments to find out.
- Design and implement a predator-prey simulation in Snap!. For example, you could model an environment with wolf and deer populations where the wolf prey on the deer. What are some parameters you need to incorporate into your model so you can simulate realistic fluctuations in the populations of predator and prey?
-
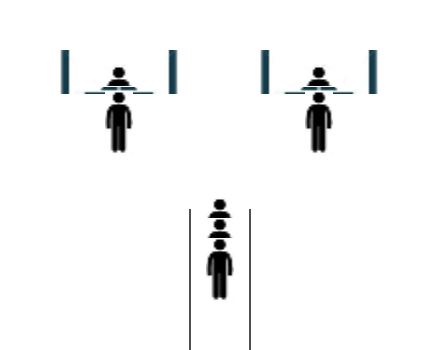
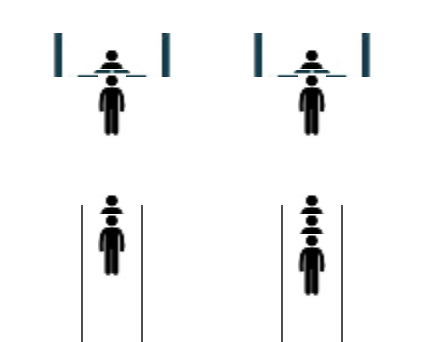
Imagine you work at a bank that wants to minimize customer wait times in line. The bank is considering two alternatives:
- a single line where the customers stand in arrival order and wait for the next available teller, or
- separate lines for each teller.
Design and implement two simulations in Snap! to help the bank determine the average wait time for customers in each scenario in order to choose the best option.


- Do some research: Why do (most) banks use a single teller line, but (most) grocery stores use a line per checkout station?